Breaking It Down: Let's Take A Look At Relative Strength
'Breaking It Down,' where we embark on a journey into the world of futures, commodities, bonds, equities and more! In this edition, we shift our spotlight to the intricacies of Relative Strength.
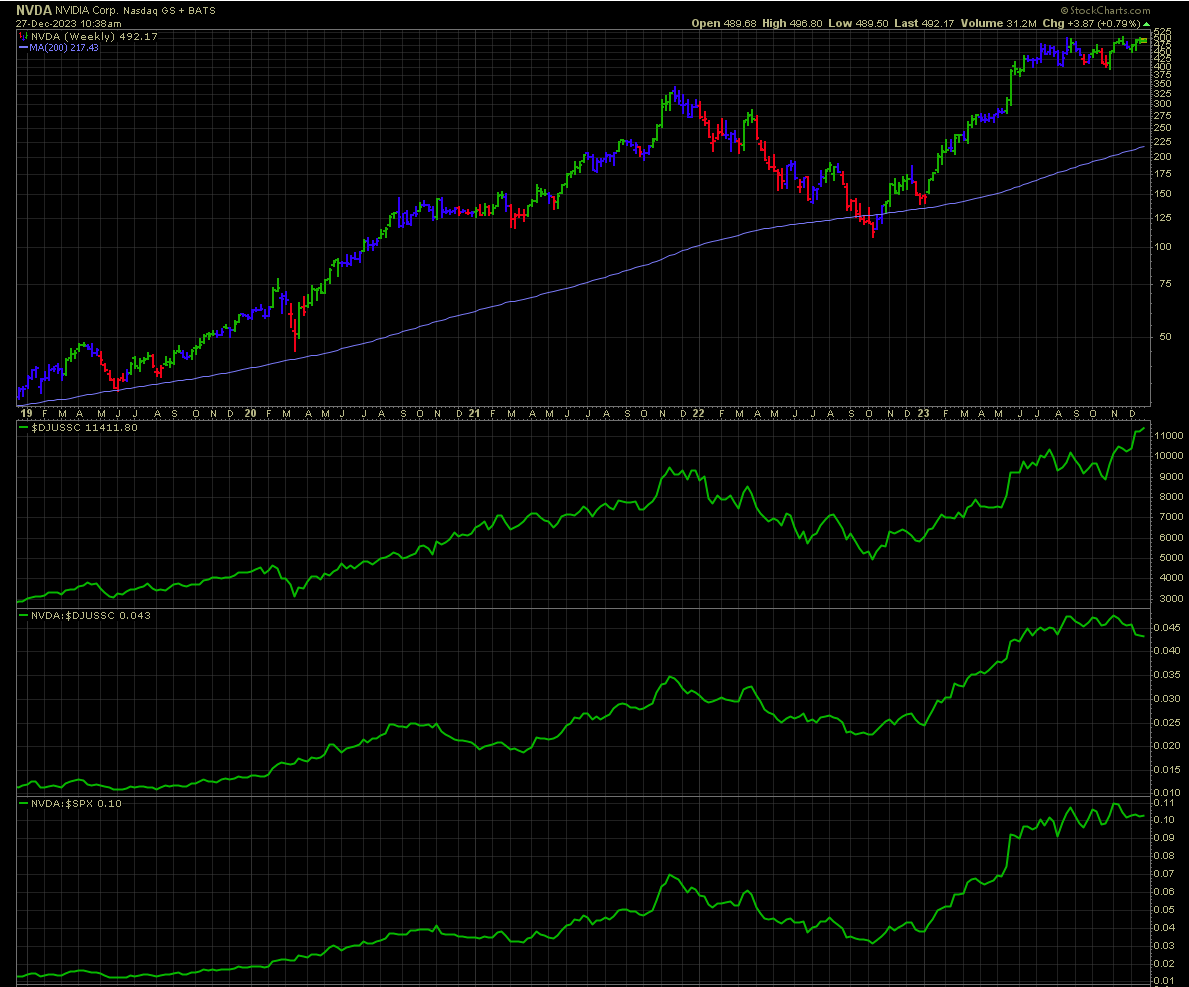
1. Introduction to the Relative Strength
The Relative Strength Indicator (RS), also known as the Relative Strength Comparative, is a powerful tool in financial analysis. It employs a ratio chart to compare the performance of one security to another. This indicator is widely used to assess stock performance in various contexts.
2. Application of the Relative Strength
The RS serves several purposes, including:
Benchmarking against Market Indices: Evaluating a stock's performance against benchmark indices such as the S&P 500.
Sector and Industry Analysis: Assessing a stock's performance relative to its sector or industry group, aiding in identifying outperformance or underperformance.
Market Condition Evaluation: Identifying stocks that exhibit strength during market declines or weakness during market upswings.
3. Calculation of the Relative Strength
The calculation of the RS is straightforward; it is the ratio of the base security's price to the comparative security's price. Typically, the base security is a stock, and the benchmark is often represented by indices like the S&P 500.
Example: RS of Exxon Mobil (XOM) relative to the S&P 500 ($SPX) is calculated as XOM Price / S&P 500 Price.
4. Interpreting the Relative Strength
The RS is instrumental in gauging relative strength, a crucial factor in stock selection. Portfolio managers often compare their performance to benchmarks, seeking to outperform. The RS rises when a stock exhibits strength compared to its benchmark and falls when it shows weakness.
Trend Analysis: Chartists can analyze trends using the RS, employing methods such as trendlines, support/resistance breaks, and moving averages.
Divergence Analysis: Identifying bullish and bearish divergences in relative strength can signal potential reversals in stock prices.
5. Bullish/Bearish Divergences
Bullish Divergence: Indicates relative strength during a price decline, suggesting resilience in the face of market downturns.
Bearish Divergence: Signals relative weakness during a price advance, hinting at potential declines when the market reverses.
6. Application Beyond Individual Stocks
While this article focuses on using the RS for individual stocks, it is essential to note its applicability in broad market analysis. By applying the RS to sector SPDRs, commodities, bonds… investors can identify leading and lagging sectors, helping inform investment strategies.
7. Conclusion: Using the Relative Strength Wisely
In conclusion, the Relative Strength Indicator is a valuable tool for investors and analysts. However, like any indicator, it should be used in conjunction with other technical analysis tools. Combining the RS with momentum oscillators and chart patterns enhances its effectiveness in confirming or refuting relative strength or weakness.
Remember, informed decision-making involves a comprehensive approach, and the Relative Strength Indicator is a valuable addition to your analytical toolkit.
Stay informed. Stay resilient. Against all odds.
Warm regards, Jason Perz
If you find this content valuable, please consider liking, sharing, and subscribing. Feel free to pass it along if you think it can benefit others.
YouTube: @againstalloddsresearch https://www.youtube.com/channel/UCLvDNCnhNQbQnABUSFbwagg
Twitter: @jasonp138
Substack: aaoresearch.substack.com
Against All Odds Research
jperz1985@icloud.com
AAOResearch.com


