Portfolio Review: From Breakouts to Blowoff Tops-Precious Metals
The breakout is underway—and we’re loading up on juniors before ignition.
Gold usually moves first. Silver follows with force
That’s been the pattern for decades. You saw it in the 1970s, again in the early 2000s, and during the 2010 spike. Gold breaks out, draws in capital, and sets the tone. Then silver plays catch up—quickly and aggressively.
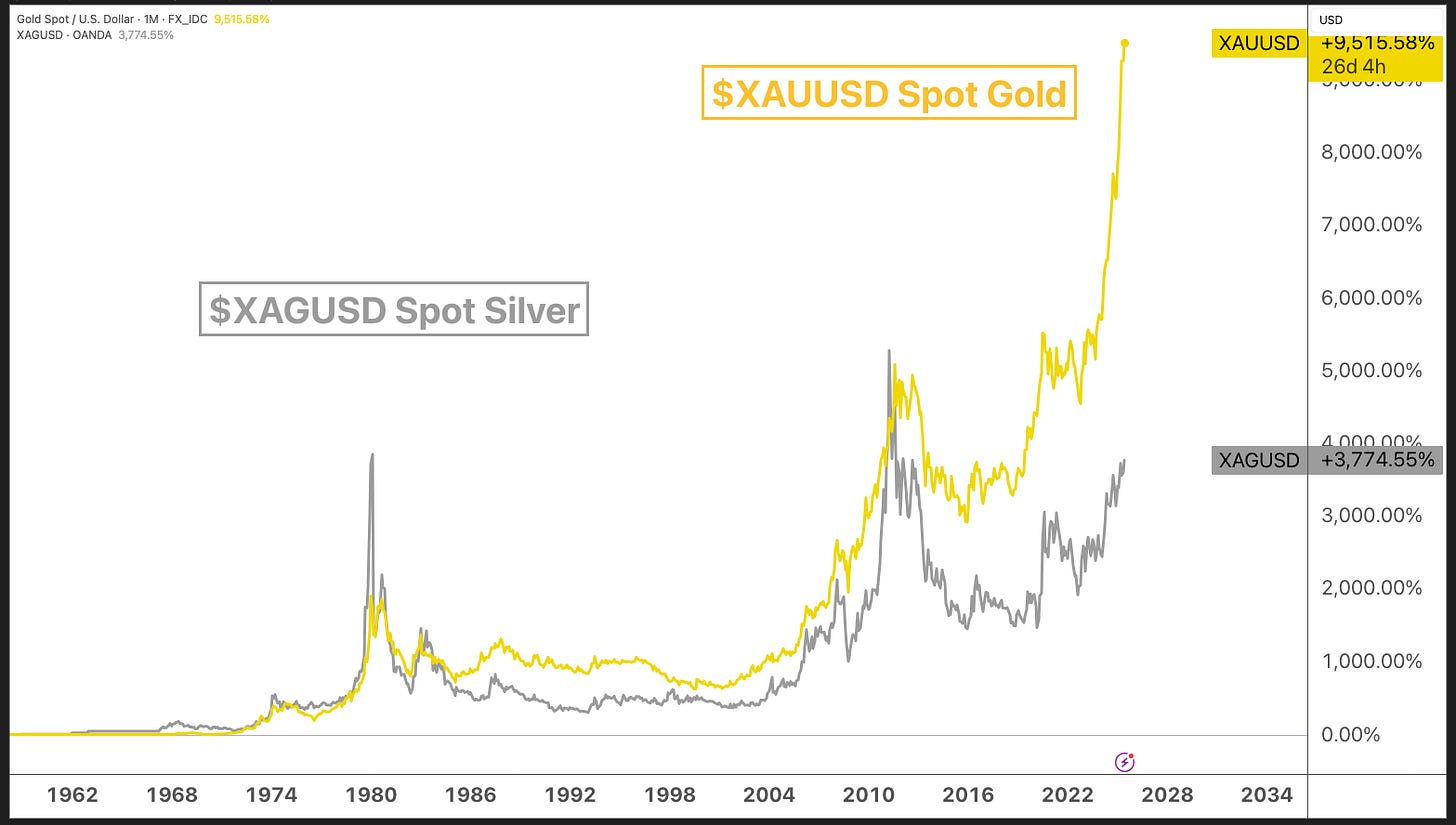
This chart tells the story.
Since the 1970s, gold is up over 9,500%. Silver is up just under 3,800%. It’s not that silver underperformed forever. It just tends to move in bursts—after gold clears the way.
Those bursts can be fast, crowded, and highly profitable for the ones who were early.
And today silver is working on its highest close since 2013.
That’s why our portfolio has been backed by gold all year. While most investors debated whether the Fed was done or if inflation was transitory, we focused on price. And gold was breaking out—above resistance, on strong relative strength, with falling real yields behind it.
It’s one of the key reasons we’re having a good year.
We didn’t need to catch every rotation or time every macro headline. We needed to be long the thing that was already telling the truth.
Now, silver is starting to stir.
If history is any guide, this is where silver starts to run.
We’re watching it closely—and we’re ready to lean in if it triggers.
The setup is familiar. And the market has seen this movie before.


