The S&P 493: A Closer Look at Its 4% Year-to-Date Gain
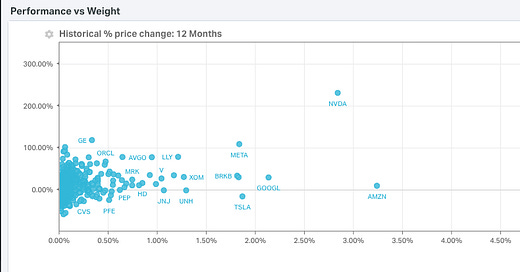
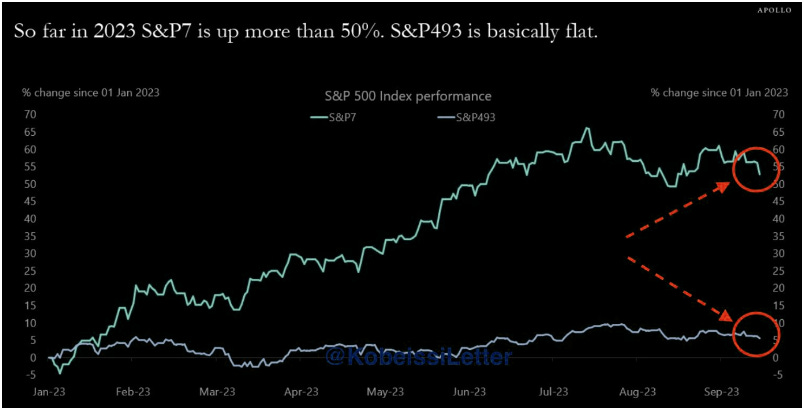
The other 493 stocks in the SPX has shown a relatively modest performance this year, posting a year-to-date gain of only 4%. This specific index excludes seven prominent technology stocks from its composition.
This performance metric provides insight into the market's dynamics by focusing on a subset of S&P 500 constituents, specifically those beyond the technology sector. By excluding these select tech stocks, the S&P 493 offers a different perspective on market performance, one that may be influenced by factors such as shifts in investor sentiment, sectoral rotations, or varying degrees of economic influence across industries.
Source: Kobeissi


