What you need to know about Oil
From 'Oil for Food' to Global Market Dynamics and How to Navigate it
Welcome to an exploration of Global Oil Dynamics: From 'Oil for Food' to Present Market Realities. Subtitle: Tracing the Evolution of International Oil Strategies from the 1990s to Today. In this analysis, we look into the global landscape, navigating through the intricacies of evolving oil market dynamics. Join us as we trace the resilient journey, uncovering pivotal moments and strategic shifts that have shaped the international oil arena from the tumultuous events of the 1990s to the present day.
Oil Monthly-we're in a crucial support zone. While I briefly mentioned it last week, a deeper examination allows us to trace its historical significance. I'll be diving into this in more detail during our upcoming audio session, exploring its roots and intricacies. Interestingly, in my search, I couldn't find a chart that thoroughly covers all these significant events the way I wanted to. So here it is.
Hey there! We're on a mission to share valuable content, and we could really use your support. If you find our content helpful or entertaining, consider giving it a thumbs up, sharing it with your friends, and hitting that subscribe button. Your support means the world to us, and it helps us reach even more people. Thanks a bunch!
If you don’t remember Shock and Awe…
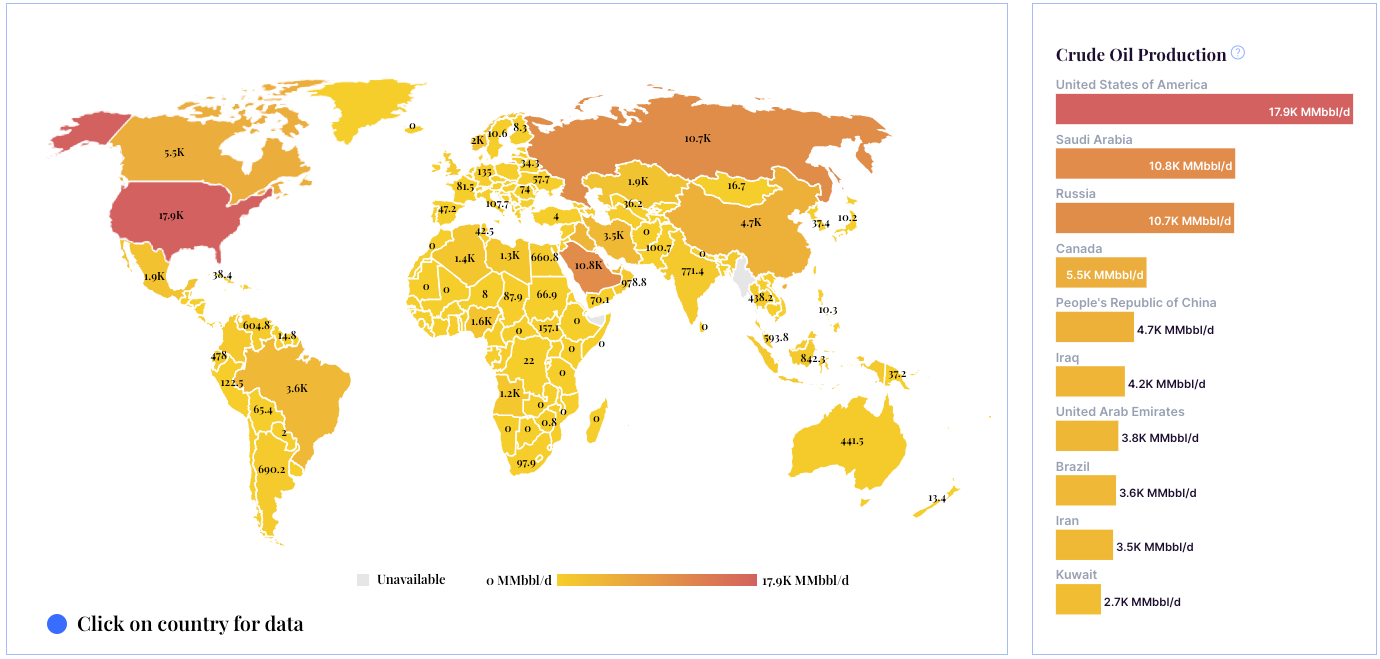
Oil production by country in 2023.
In an unexpected development, U.S. crude oil production has defied earlier forecasts by surging to an unprecedented high of over 13 million barrels per day in September, maintaining the country's position as the world's leading oil producer. Despite a projected 1% reduction in spending for 2024, analysts anticipate sustained growth fueled by efficiency gains and advanced drilling techniques, showcasing the industry's shift towards measured growth and increased investor returns.
The surge in U.S. oil production not only solidifies its dominance among the five largest oil-producing nations, surpassing Saudi Arabia, Russia, and Canada, but also results in soaring exports of crude oil and petroleum products. The United States is on track to average 12.93 million barrels per day this year, with expectations to further increase to 13.11 million barrels per day in 2024, according to the U.S. Energy Information Administration. This remarkable production level is prompting a strategic focus on capital and operational efficiency in the U.S. shale patch, aiming to demonstrate a transition from growth at all costs to a balanced approach with higher returns to shareholders.
While the U.S. experiences this unprecedented growth, Saudi Arabia, as the leader of OPEC, implements voluntary production cuts to stabilize the market. Russia, a key partner in the OPEC+ alliance, faces challenges regarding transparency in its oil sector, while simultaneously committing to deeper export cuts in the first quarter of 2024. In contrast, North America, not only with the U.S. but also Canada, is expanding its production. Canadian oil production hit a record 4.86 million barrels per day last year, and analysts anticipate an 8% growth in Canada's crude oil production by 2025, driven by increased production in Alberta's oil sands.
Oil Consumption by Country
What states are leading this boom.
Texas stands out as the primary contributor to the record-breaking U.S. oil production, accounting for a significant 42.6% of the total output. This substantial share is attributed to the booming production in the Permian Basin. New Mexico follows as the second-largest oil producer nationally, experiencing an impressive 190% surge in production over the last five years, largely influenced by the Permian Basin's effect.
While North Dakota's oil production remains above one million barrels per day, it has seen a decline from its peak. However, there's been a recent uptick, with a 17% increase over the past year. Among the eleven states presented, five have witnessed a decline in production over the last five years. Notably, Ohio, not traditionally recognized as a leading oil producer, is experiencing modest yet growing production due to developments in the Utica Shale in the Appalachian Basin.
California, once the top U.S. oil producer a century ago, has experienced a steady decline in production, dropping by 30.7% over the last five years—the most significant reduction among major producers. It is noteworthy that this analysis excludes federal offshore production in the Gulf of Mexico, which contributed an additional 1.84 million barrels per day over the past year, marking a 9.3% increase compared to five years ago and approaching the record level set in 2019.


