
You Don’t Need a PhD to Follow the Curve
Every boom starts the same: Steep. Liquid. Explosive.

When the yield curve steepens, it’s like oxygen getting pumped into the system.
This chart shows the full curve—2s, 5s, 10s, 30s—stretching out after years of flat or inverted conditions. That shift isn’t just academic. It means the market is saying: “We’re back to borrowing, lending, building.”
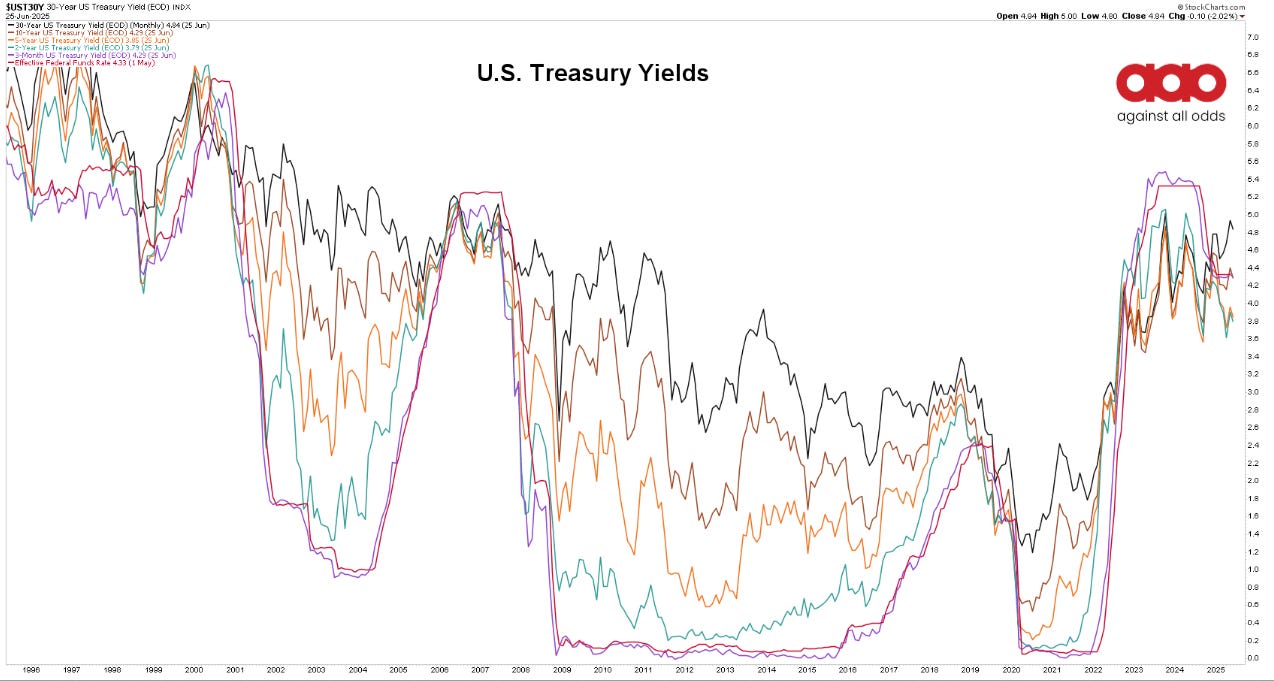
A steep curve means banks can borrow short and lend long. That’s how money gets made in the system. Liquidity starts to move. It spills into balance sheets, into risk assets, into commodities. We’ve seen it before: 2003, 2009, 2020. Every time the curve turned up, capital rotated hard into cyclical stocks and raw materials.

That’s what this chart is showing you. That’s the roadmap.
The bond market doesn’t whisper. It shouts. And right now, it’s saying the regime is shifting. You want to know when to get long commodities? When to bet on reflation? Watch the curve.
Because when it steepens like this, it’s not just a signal—it’s fuel to a fire that’s still smoldering.
The Curve Steepens. Growth Breathes. Copper Moves.
The steepening yield curve isn’t just a U.S. story—it’s a global pulse.
When short rates fall and long rates rise, the curve steepens. That’s not some spreadsheet phenomenon. That’s global money getting greenlit. It means lending works again. It means growth is being priced back in.
And we’re seeing it—in copper miners.
Check out the COPX 0.00%↑ ETF decisively breaking out of its downtrend line.
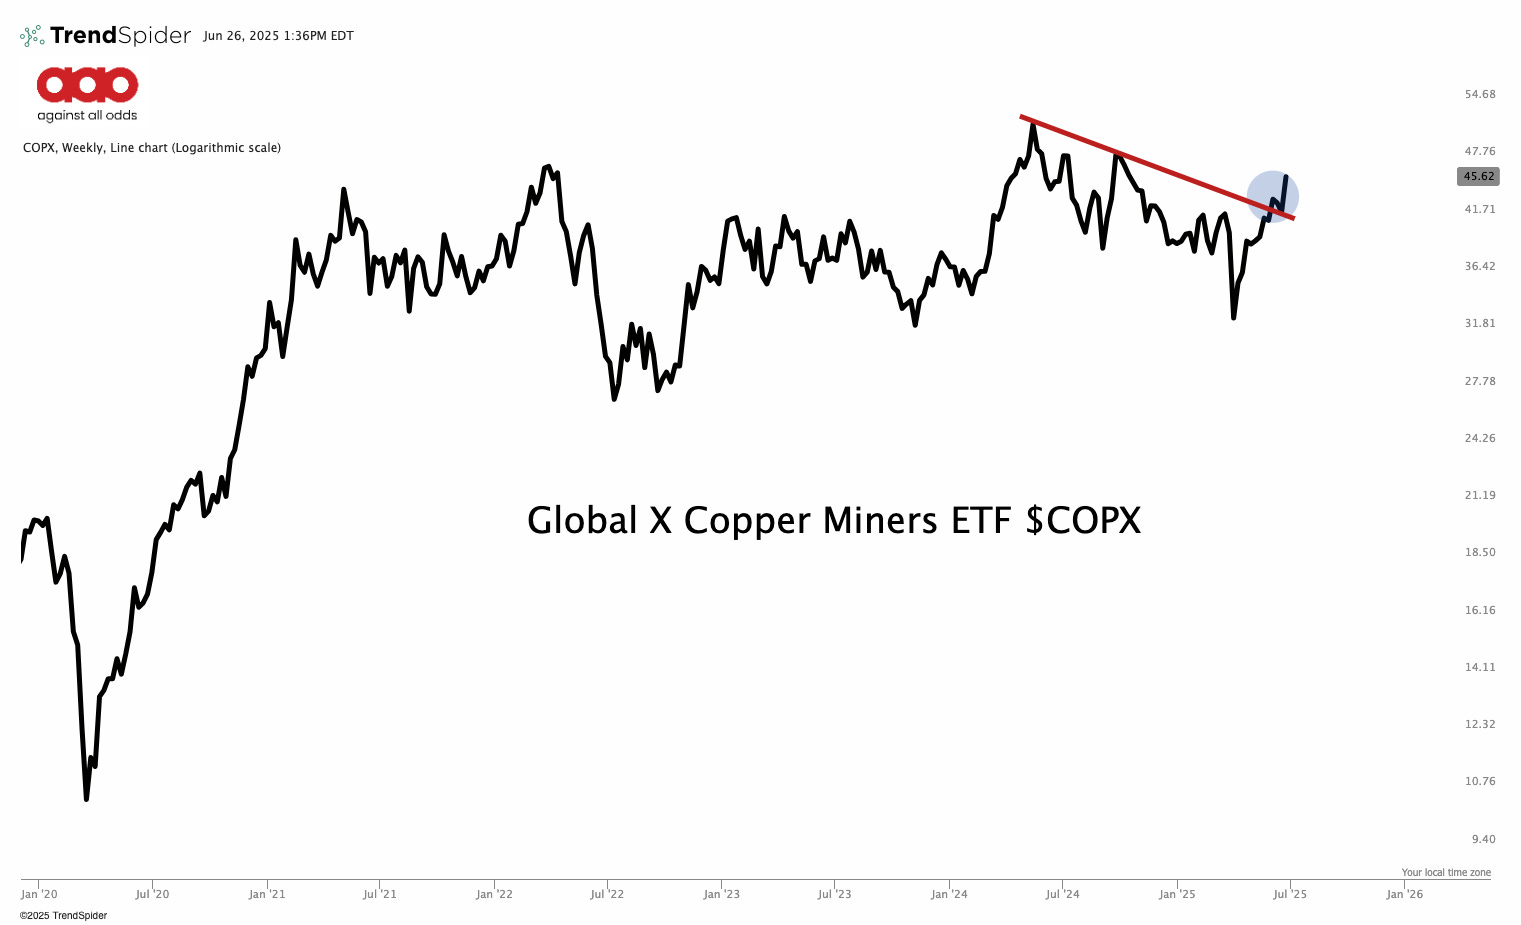
Copper isn’t just a metal. It’s growth in disguise. It flows through wires, homes, EVs, grids, and ports. When copper miners start to break out, they’re not betting on rate cuts—they’re betting on demand. Real, structural demand.
Look at the charts of all of them SCCO, FCX, BVN... Miners are curling higher. Price is coiling. Breakouts are starting to trigger.
That’s the market breathing again.
You don’t get that unless global growth expectations are turning soon. And the curve? It’s telling you just that.
This is how commodity cycles start. Liquidity returns. Credit expands. Miners move.
Don’t wait for the headlines. Price already told you what’s coming.
Bonus:
Stay ready for this one…

I keep sharing BVN 0.00%↑ , because this is one hell of a set up.
Keep it on your radar.
Against All Odds Research
Stay Connected:
YouTube: Against All Odds Research Channel (@againstalloddsresearch)
Twitter: Jason P (@jasonp138)
Substack: AAO Research
Support the Bees: Help save the native bees! Learn more and get involved here.